Market Basket Analysis

I am an Analytical Engineer and I share my learning progress...
Project Description
Market Basket Analysis using PySpark to identify associations between different products. To determine which items are often purchased together and derive insights to optimize product placements and promotions.
Dataset:
Sample Super Store Data set
# Import Necessary Libraries
from pyspark.sql import SparkSession
from pyspark.ml.fpm import FPGrowth
from pyspark.sql.functions import col, sum as spark_sum
from pyspark.sql.functions import col, avg, when
import pandas as pd
import numpy as np

# Initialize SparkSession
spark = SparkSession.builder \
    .appName("MarketBasketAnalysis") \
    .getOrCreate()
# Uploading the dataset store.csv into the Spark session

file_path = "store.csv"
df = spark.read \
    .format("csv") \
    .option("header", "true") \
    .option("inferSchema", "true") \
    .load(file_path)
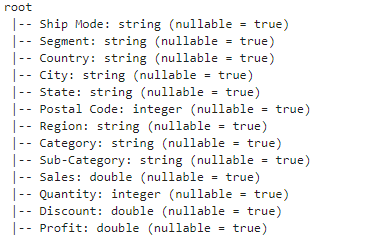
# Display the schema of the DataFrame
df.printSchema()
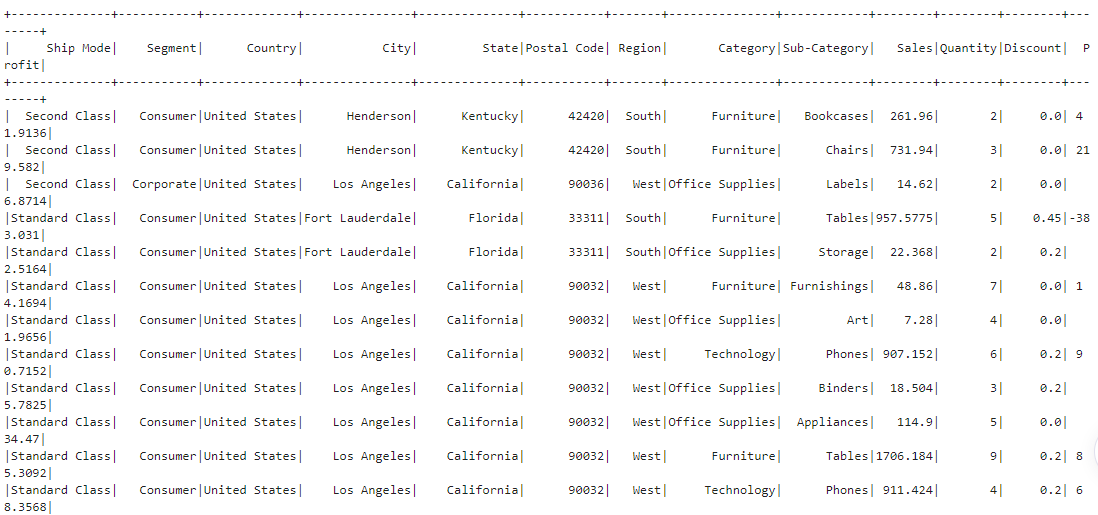
# Show the first few rows of the DataFrame
df.show()
# Checking the all the columns in my data set

print("My store data set columns are: ")
df.columns

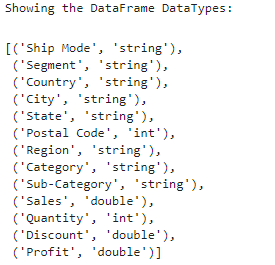
# Checking DataFrame types
print("Showing the DataFrame DataTypes: \n")
df.dtypes
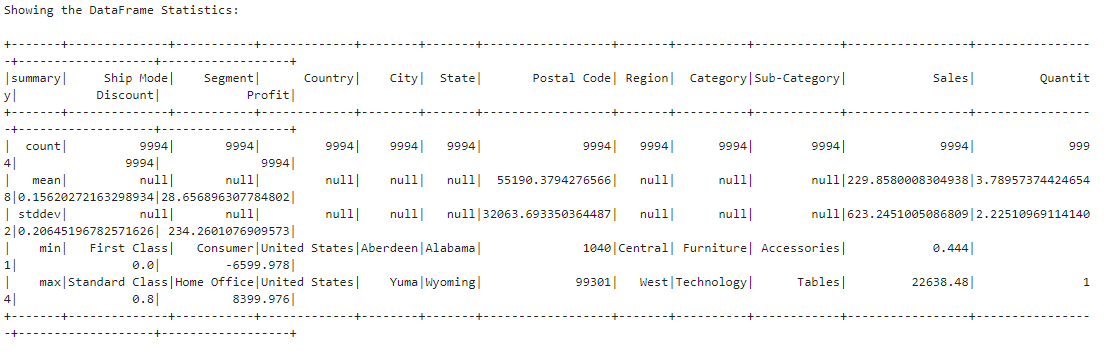
# Summary statistics
print("Showing the DataFrame Statistics: \n")
df.describe().show()
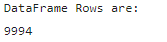
# Count rows in DataFrame
print("DataFrame Rows are:")
df.count()
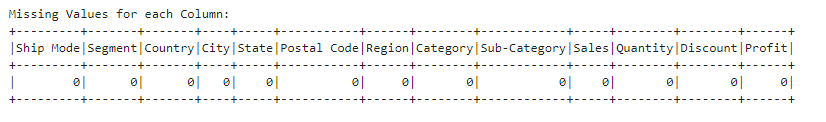
# Finding Missing Values for each Column
print("\nMissing Values for each Column:")
missing_counts = df.agg(*(spark_sum(col(c).isNull().cast("int")).alias(c) for c in df.columns))
missing_counts.show()
# Preprocessing the data to create a transaction dataset:

# The 'Sub-Category' column contains the items being purchased
transactions_df = df.groupBy("State", "Sub-Category").agg({"Quantity": "sum"}).withColumnRenamed("sum(Quantity)", "Quantity")
print("The Transaction Dataset are: \n")
transactions_df.show()

FPGrowth (Frequent Pattern Growth)
Is a popular algorithm used for mining frequent itemsets in transactional databases. It's a method of performing association rule mining, which involves discovering relationships or associations between items in a dataset. FPGrowth is particularly efficient in handling large datasets and is widely used for tasks like market basket analysis, where you want to uncover patterns of items frequently purchased together.
# Converting the transaction data into the required format for FPGrowth:

from pyspark.sql.functions import collect_list

transactions_grouped_df = transactions_df.groupBy("State").agg(collect_list("Sub-Category").alias("items"))
print("The grouped transaction datasets are: \n")
transactions_grouped_df.show()

# Applying FPGrowth algorithm to perform Market Basket Analysis:
fp_growth = FPGrowth(itemsCol="items", minSupport=0.05, minConfidence=0.2)
model = fp_growth.fit(transactions_grouped_df)
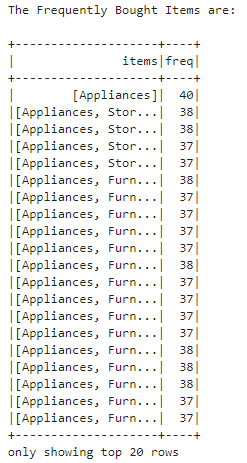
# Display frequent itemsets
frequent_itemsets = model.freqItemsets
print("The Frequently Bought Items are: \n")
frequent_itemsets.show()
# Display association rules
association_rules = model.associationRules
print("The association Rules Are: \n")
association_rules.show()

Each row in the output represents an association rule:
antecedent: This column contains the antecedent items, which are the items that are found in the "if" part of the rule. These are the items that are typically purchased together.consequent: This column contains the consequent item, which is the item that is found in the "then" part of the rule. This is the item that tends to be purchased along with the antecedent items.confidence: Confidence is a measure of how often the consequent item is purchased when the antecedent items are purchased. It's calculated as the ratio of the support of the combined items (antecedent and consequent) to the support of the antecedent items alone. For example, a confidence of 0.875 means that when the antecedent items are purchased, there's an 87.5% chance of also purchasing the consequent item.lift: Lift is a measure of the strength of the association between the antecedent and consequent items. It compares the observed support of the combined items to what would be expected if they were purchased independently. A lift greater than 1 indicates a positive association between the items. For example, a lift of 1.299 indicates that the presence of the antecedent items increases the chances of purchasing the consequent item by 29.9% compared to if they were purchased independently.support: Support represents the frequency with which the entire rule (both antecedent and consequent items) appears in the dataset. It's calculated as the ratio of the number of transactions containing the rule to the total number of training efforts.


